After a week at looking at maps made with D3.js and watching Lynda videos on D3 and HTML, my prototype for my final project is done entirely in P5.js. I realized my inexperience with HTML and CSS meant getting past the learning curve would take longer than a week. But, I think I will be able to test the functionalities of my final product with my first prototype.
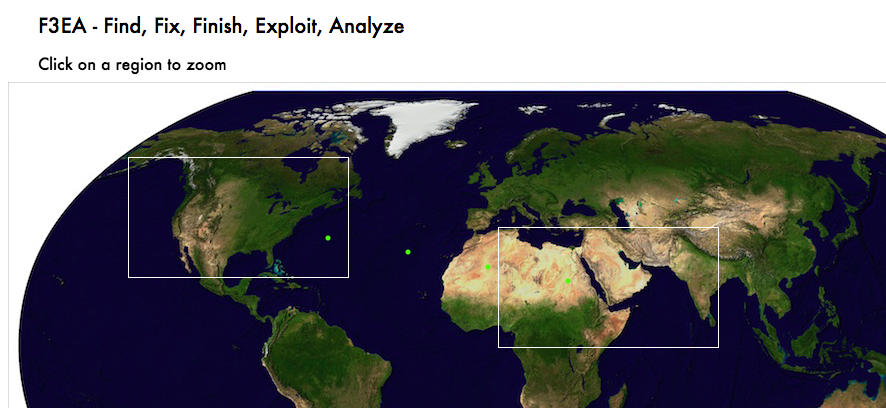
I’d like to be able to use an actual map in order to use coordinates, and the entire sketch is missing a lot of information that I’ve been organizing separately, from various sources. I have a long list of improvements, and questions about integrating DOM elements, P5.js and D3.js.
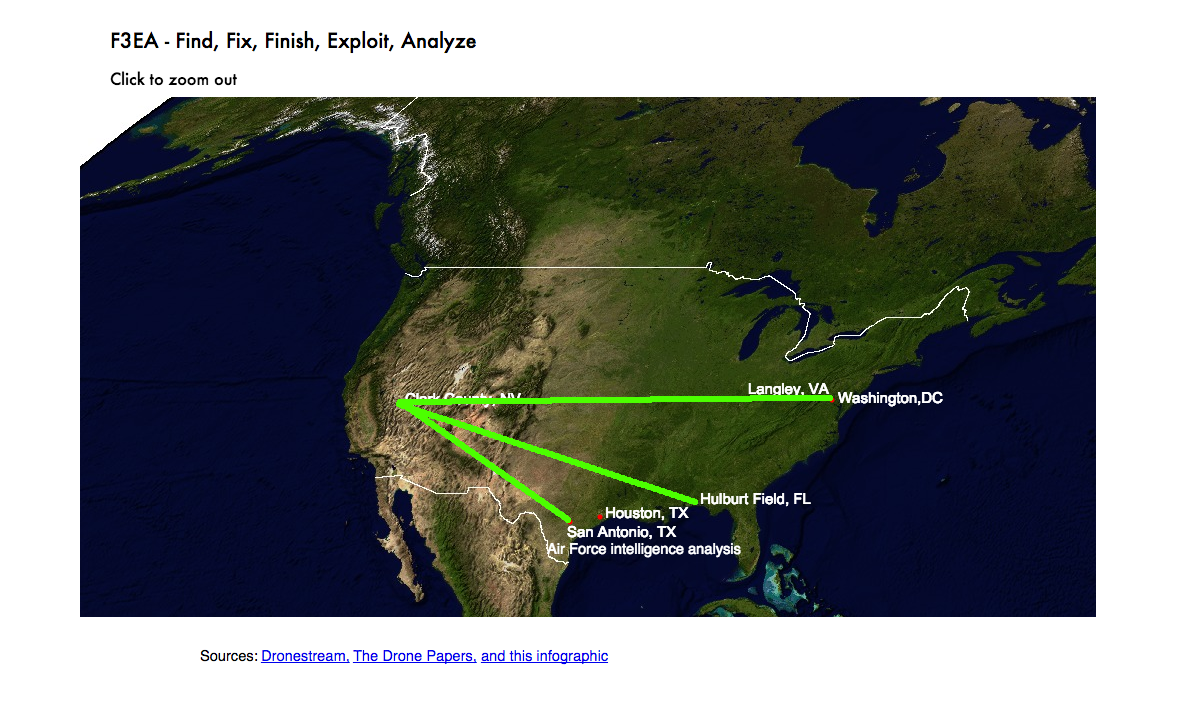
Mousing over cities reveals text created with p5.dom.js, but this messes with my animation
Eventually I want to cycle through number of strikes per country where the data are available, but currently the code I’ve written only returns the final sum. I haven’t yet figured out why it isn’t working correctly.
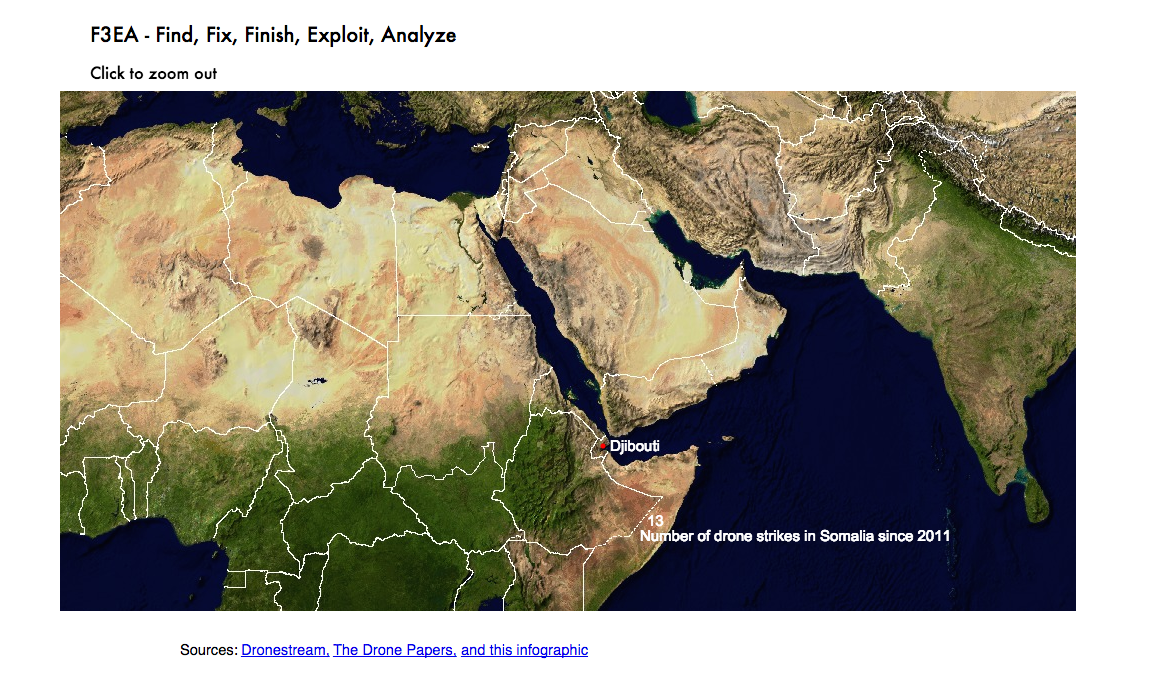
There should be better indicators of where to mouse over for information, but this piece is missing many areas of interest
I’m sure my play-testers will reveal other deficiencies and give valuable feedback!